How we became BI PIoneers
Quite often people ask me what our BI like software OpenPi is special for. Good question! There are tons of BI tools around like Tableau, Power BI and Co. On capterra you'll find 400 and more... So where is the point to develop another one?
As an engineer, I often deal with process data. Millions of values, thousands of measurements, dozens of units. I analyse them, model with them and base decisions on them – many times with pure Excel, like almost everyone. When being on site (mostly power stations or WtE plants), of course I use their data acquisition system.
So wouldn't it be cool to have something in between? Flexible and cheap like Excel but also convenient and fast like a DCS? Minimum requirements are:
- flexible import (because import files always are different),
- add new data as easy as possible,
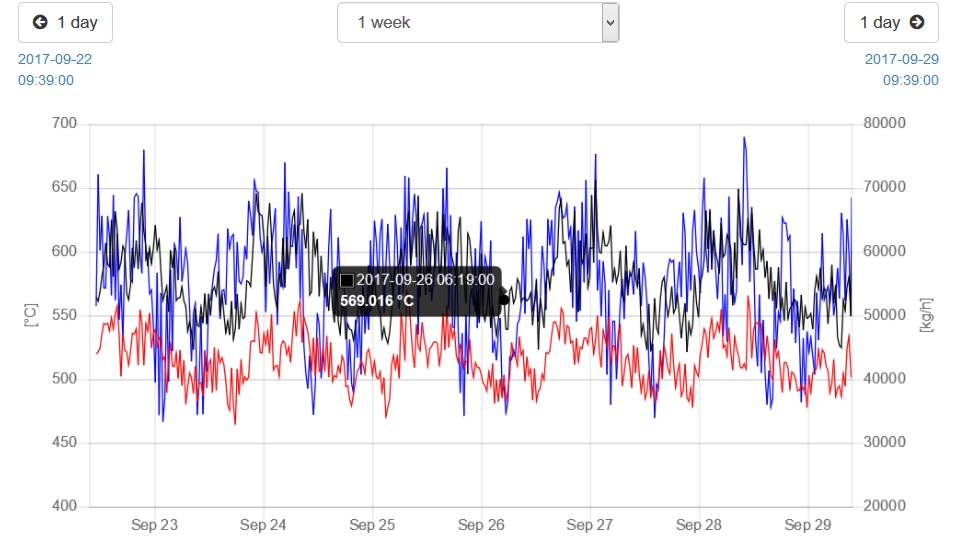
- charts: zoom, scroll, add/remove trends per mouse click,
- interval calculations: raw values into regular once, changing periods and so on,
- upload additional docs (R&Is, drawings, calculations),
- fluid property functions available: water-steam, air, flue gas, …,
- artificial intelligence available (to figure out what engineers can do with it),
but also:
- full data control: where (country) and how long stored,
- possibility to improve/innovate continuously.
Are there any BI tools around fulfilling these just basic requirements? To be honest I don't know. But as engineering is not only data and nice charts I don't think so...
That's what OpenPi is special for and that's why we created it:
 Dr.-Ing. Martin
Horeni, 04/2019
Dr.-Ing. Martin
Horeni, 04/2019